Highlighted Skills
Hi! My name is Ruchella Kock and welcome to my online portfolio
This website is a collection of my favorite projects.
Main topics include data visualization, statistics and machine learning
Data visualizations
I have created an array of dashboards focusing on both data analytics and information visualization.
D3
Bootstrap
Javascript

D3 animations
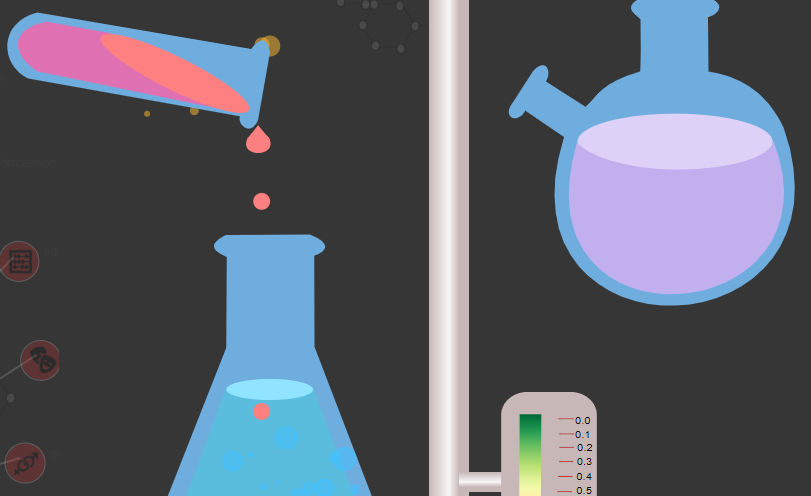
Information visualization project with d3.js animations.
Collaboration project with Hessel Dikkers and Glen Cripps.
March to April 2020
See more
Dashboards
Data analytics and information visualization project made in D3.js.
January 2019 to March 2020
See moreStatistics and Machine Learning
In my bachelor thesis on statistics, I compared t-test with the permutation test.
In my master I have trained a neural net for food image classification.
Sklearn
Python
Computer Vision
Statistics

Image classification
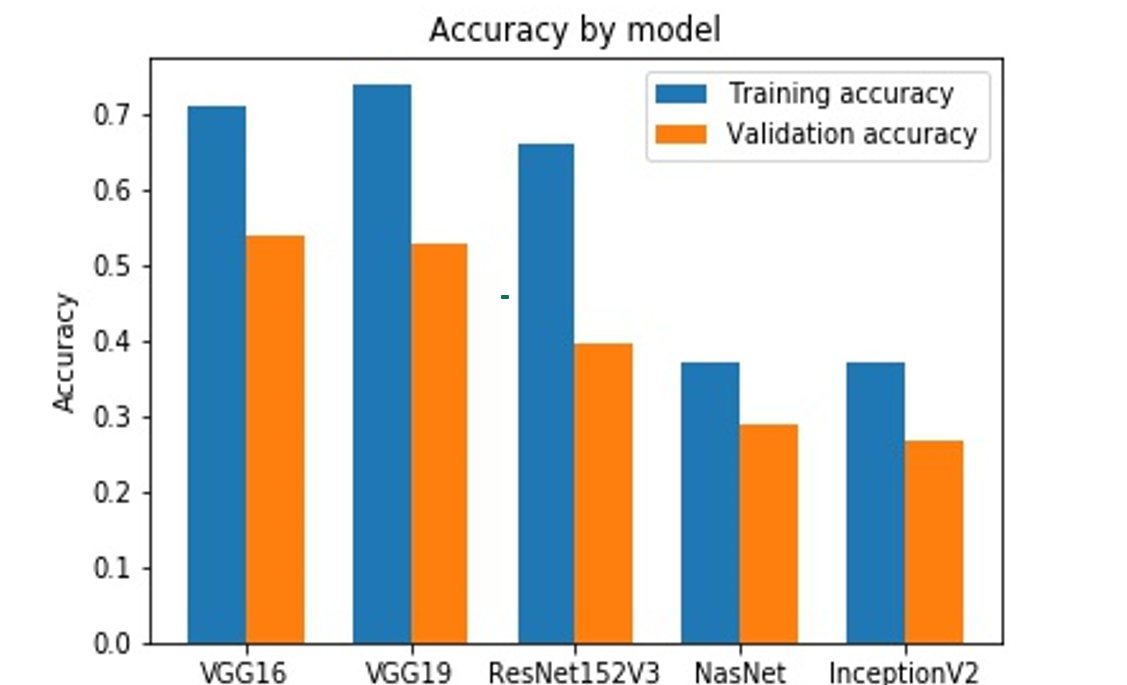
This is a computer vision project, classifying food images with keras.
November to December 2019
See more
T-test versus Permutation test
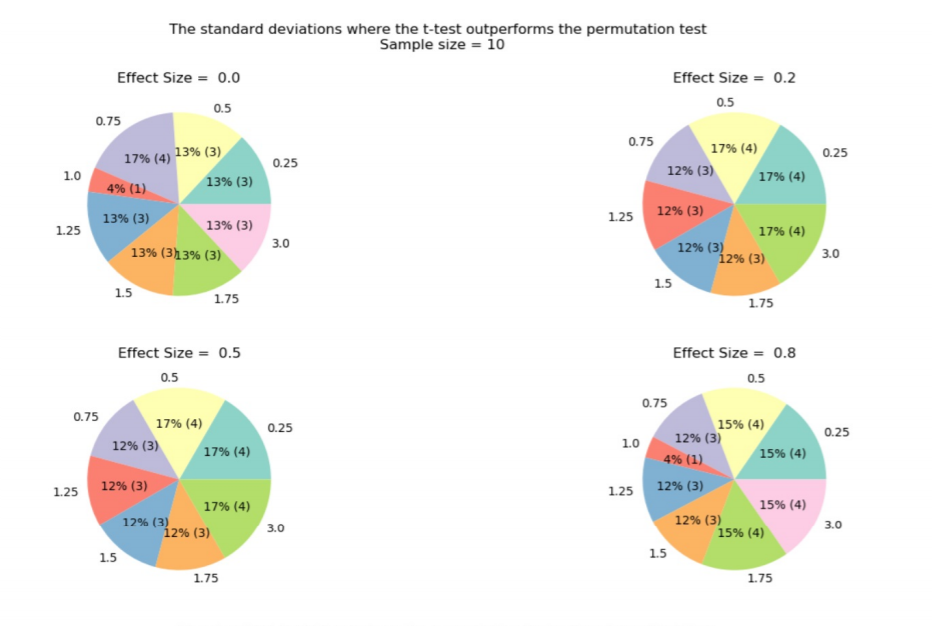
As my Bachelors Thesis, I performed a simulation study in R, comparing Welch's t-test to the Permutation test in terms of the assumption of Homogeneity. The Data analysis was performed in python.
February to June 2019
See moreWeb development
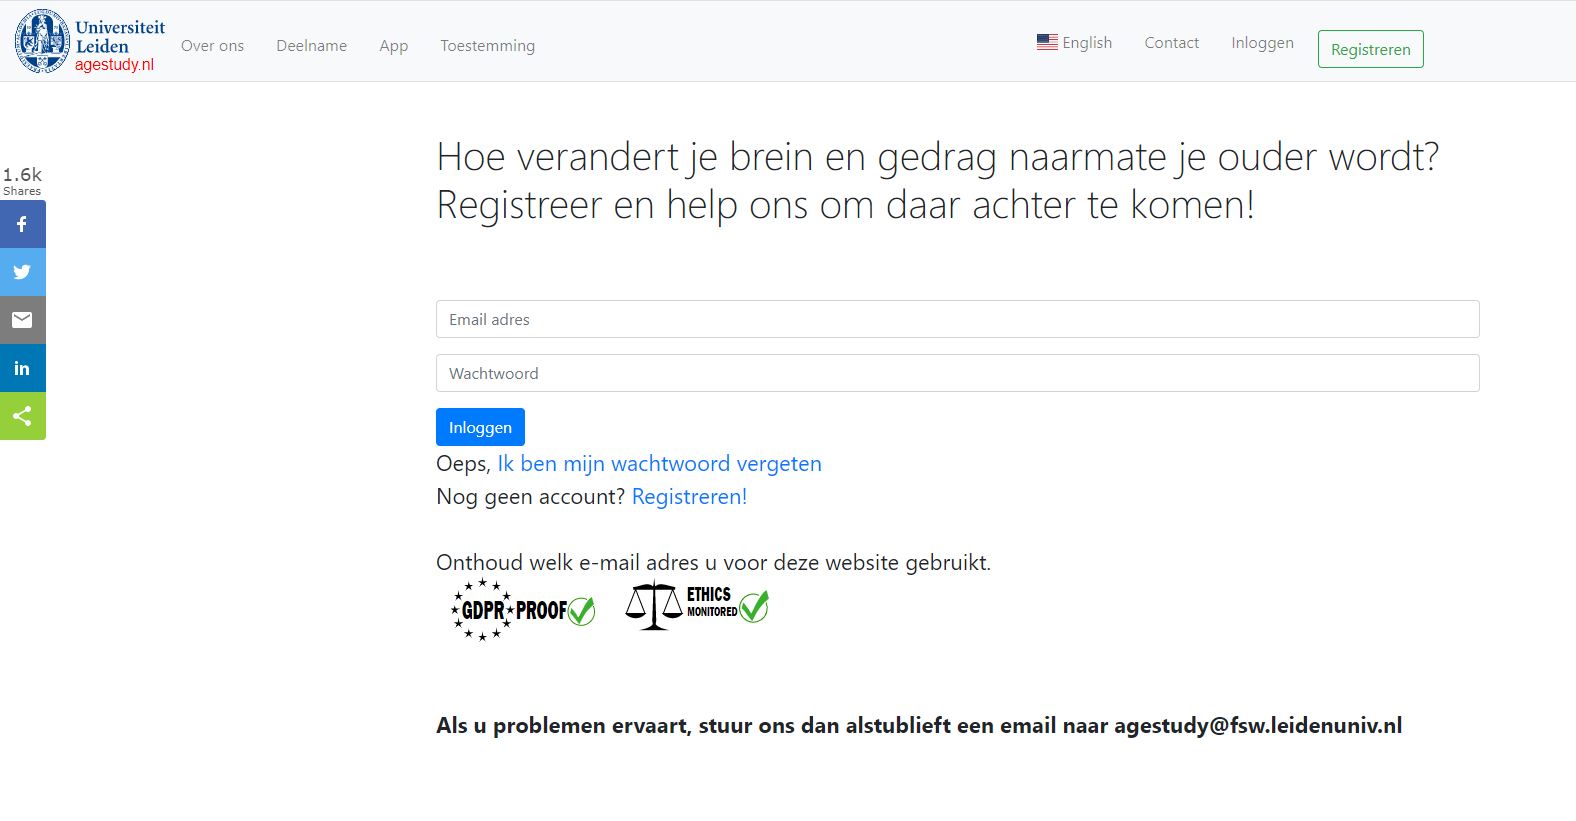
Developer of agestudy.nl a platform for a scientific study conducted by Leiden University to study healthy ageing across a wide range of individuals.
Python
Postgressql
Data viz

Education
Job Experience
International Bachelor in Psychology
Leiden University
I have completed the International Bachelor in Psychology (IBP) programme.
With my specializations in: Clinical neuropsychology, Applied cognitive psycholgy and Cognitive neuroscience
Electives: Artificial Intelligence and Causal Inference in Field Experiments
Student Assistant
Leiden University
Developer of agestudy.nl a platform for a scientific study conducted by Leiden University to study healthy ageing across a wide range of individuals. Platform developed using Python. Running on cloud technologies. Contains Javascript (D3) data visualizations.
Master Information Studies - Data Science
University of Amsterdam
I am currently following the Data Science track from the Master Information studies.
With my specializations in: Information Visualization and Information Organization
Student Assistant
Het Kabinet van de Gevolmachtigde Minister van Aruba
As a student assistant I am part of the hosting commission that welcomes students coming from Aruba to study in the Netherlands. I provide assistance to the mentors. I help them plan the introduction week for the students. It involves activities such as getting a Dutch bank account or getting to know the city they are going to live in. We also plan events throughout the year.
About me
I love finding patterns and previously unknown information in a large amount of data and making it accessible and clear to anyone.
Which is the dream of most data scientists. To me this has manifested in creating visualizations to explain different algorithms and their outcomes.
It all started out with a bachelor in psychology specializing in cognitive and neuropsychology.
I followed my great interest in the human brain.
I loved how it is so complex and rich of data. As I was studying cogniton, I wondered if it can be simulated.
If all the same structures and processes of the brain can be mapped out would it be possible to create cognition.
As a result I took a minor in programming and an elective in Artificial intelligence.
It was in my minor I realized what drew me to the brain: information.
It sounds very broad and vague but I realized I love how the brain processes information.
E.g. how it can perceive a stimulus and give it a whole meaning.
I also realized how important it is to me to understand and share information.
This led me to my master in Information Studies, Data Science, which I am currently persuing.
I am currently specializing in data visualization and exploring machine learning.

